International Ocean Freight Shipping: Cost Structures, Transit Control, and Container Optimization
4 min read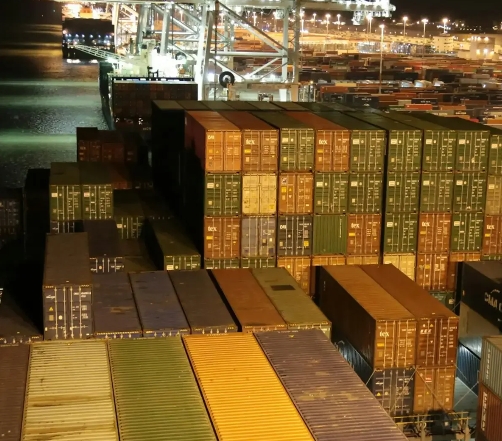
In global supply chains, international ocean freight shipping remains the backbone of bulk cargo movement, accounting for over 80% of world trade by volume. Despite its scale and cost advantages, the complexity behind ocean freight—ranging from container selection to transit reliability—requires engineering-level decision-making rather than simple rate comparison.
This article provides a technical, scenario-driven analysis of international ocean freight shipping, focusing on cost composition, container optimization, transit control, and risk mitigation. The goal is to help businesses make measurable, data-driven logistics decisions.
1. Cost Structure: Breaking Down Ocean Freight Beyond the Quoted Rate
Many shippers focus on the base ocean freight rate, but in practice, this is only one component of the total landed cost.
Core Cost Components
-
Ocean Freight (Base Rate)
-
40HQ (High Cube): $2,500–$5,500 depending on route
-
LCL: $80–$180 per CBM
-
Typically quoted per container (FCL) or per cubic meter (LCL)
-
Example:
Bunker Adjustment Factor (BAF)
-
Fuel surcharge linked to marine fuel prices
-
Can account for 10–25% of base rate
Terminal Handling Charges (THC)
-
Charged at both origin and destination
-
Typically $150–$400 per container
Documentation and Compliance Fees
-
Bill of lading issuance
-
Export/import documentation
-
Customs filing
Destination Charges
-
Port handling, delivery order, customs clearance
-
Often underestimated but critical for budgeting
Example Total Cost Comparison (China → US West Coast)
| Cost Component | 40HQ (USD) |
|---|---|
| Base Ocean Freight | 3,200 |
| BAF | 600 |
| Origin THC | 300 |
| Destination Charges | 450 |
| Documentation | 120 |
| Total Landed Freight Cost | 4,670 |
The takeaway: base freight may represent only 60–70% of total cost. Accurate cost modeling must include all components.
2. Container Selection: Matching Cargo Characteristics to Equipment
Choosing the wrong container type can lead to inefficiencies, damage, or compliance issues.
Standard Container Types and Use Cases
1. 20ft (20GP)
-
Capacity: ~28 CBM
-
Max payload: ~28,000 kg
-
Best for dense cargo (metal parts, machinery)
2. 40ft (40GP)
-
Capacity: ~58 CBM
-
Max payload: ~26,000 kg
-
Balanced option for general cargo
3. 40ft High Cube (40HQ)
-
Capacity: ~68 CBM
-
Extra height (+30 cm)
-
Ideal for lightweight, bulky goods
4. Specialized Containers
-
Reefer (Refrigerated)
-
Temperature range: -25°C to +25°C
-
Used for food, pharmaceuticals
-
Open Top
-
For cargo exceeding height limits
-
Loaded via crane
-
Flat Rack
-
For oversized or heavy equipment
-
No side walls or roof
Engineering Considerations
-
Weight vs. Volume Ratio
-
If cargo density > 500 kg/CBM → 20GP preferred
-
If cargo is bulky → 40HQ improves utilization
-
Load Distribution
-
Avoid point loads exceeding floor strength (~5,460 kg/m²)
-
Use pallets or steel frames for heavy machinery
-
Cargo Securing
-
Lashing points: typically 1,000–2,000 kg capacity each
-
Improper securing leads to claims and delays
3. Transit Time and Reliability: Managing Variability in Ocean Freight
Transit time is not a fixed number—it is a range influenced by multiple operational variables.
Typical Transit Time Benchmarks
| Route | Transit Time (Days) |
|---|---|
| China → US West Coast | 12–18 |
| China → US East Coast | 25–35 |
| Asia → Europe | 25–40 |
Key Factors Affecting Transit Time
-
Port Congestion
-
Adds 2–10 days delay
-
High-risk ports require buffer planning
Transshipment vs. Direct Service
-
Direct routes reduce risk
-
Transshipment adds 5–12 days
Carrier Schedule Reliability
-
Industry average: 60–75% on-time performance
-
Requires contingency planning
Weather and Seasonal Disruptions
-
Typhoons in Asia
-
Winter storms in North Atlantic
Practical Strategy
-
Add 7–10 days buffer for critical shipments
-
Use premium services for high-value cargo
-
Monitor real-time vessel tracking
4. FCL vs. LCL: Cost and Efficiency Trade-offs
Choosing between Full Container Load (FCL) and Less than Container Load (LCL) impacts both cost and risk.
FCL (Full Container Load)
Advantages:
-
Lower cost per unit at scale
-
Reduced handling → lower damage risk
-
Faster transit (no consolidation delays)
Threshold:
-
Typically economical above 12–15 CBM
LCL (Less than Container Load)
Advantages:
-
Lower upfront cost for small shipments
-
Flexible volume
Challenges:
-
Additional handling → higher damage risk
-
Consolidation delays (2–5 days)
-
Higher per-unit cost
Cost Comparison Example
| Volume | LCL Cost | FCL Equivalent | Recommendation |
|---|---|---|---|
| 5 CBM | $600 | N/A | LCL |
| 15 CBM | $1,800 | ~$2,200 (20GP shared) | Depends |
| 25 CBM | $3,000 | $2,800 (20GP) | FCL |
The decision point is not just cost—it includes time sensitivity and cargo risk profile.
5. Packaging and Cargo Protection: Engineering for Ocean Conditions
Ocean freight exposes cargo to:
-
Humidity (up to 100%)
-
Salt corrosion
-
Vibration and movement
-
Temperature fluctuations
Recommended Packaging Solutions
1. Moisture Protection
-
Desiccants: 1–2 kg per container
-
Aluminum foil vacuum packaging for sensitive equipment
2. Structural Protection
-
Wooden crates (ISPM 15 compliant)
-
Steel frames for heavy machinery
3. Anti-Corrosion Measures
-
VCI (Volatile Corrosion Inhibitor) films
-
Oil coating for metal parts
Real-World Example
Without proper moisture control:
-
Condensation (“container rain”) can damage electronics
-
Corrosion risk increases by 30–50% in long voyages
6. Customs Clearance and Compliance: Avoiding Delays and Penalties
Compliance is a critical part of international ocean freight shipping.
Key Documentation
-
Commercial Invoice
-
Packing List
-
Bill of Lading
-
Certificate of Origin
-
HS Code Classification
Common Risks
-
Incorrect HS codes → duty penalties
-
Missing documentation → clearance delays (3–7 days)
-
Non-compliant packaging → cargo rejection
Best Practices
-
Pre-verify HS codes with customs broker
-
Ensure document consistency (no discrepancies)
-
Use digital documentation systems
7. Digital Visibility: Tracking and Data Integration
Modern ocean freight is increasingly data-driven.
Key Technologies
-
Real-time vessel tracking (AIS systems)
-
Shipment management platforms
-
Electronic Data Interchange (EDI)
Benefits
-
Predictive ETA updates
-
Exception alerts (delays, route changes)
-
Improved inventory planning
8. Integrated Logistics Solutions: The Role of End-to-End Providers
Ocean freight does not operate in isolation. Efficiency depends on how well it integrates with inland transport, warehousing, and customs processes.
YUKON LOGISTICS provides end-to-end solutions, including:
-
Ocean freight (FCL/LCL)
-
Air and land transportation
-
Customs clearance
-
Warehousing and distribution
By aligning these services, they reduce handoff delays and improve shipment visibility, ensuring cargo arrives safely and on schedule.
9. Total Logistics Cost Optimization: A Practical Framework
To optimize international ocean freight shipping, focus on total system efficiency rather than individual cost elements.
Optimization Levers
- About Author